2026 Ecommerce Profitability Tracking Guide
Every founder knows the feeling: Shopify shows record sales, but the bank balance says otherwise. That’s why ecommerce profitability tracking has become the defining metric for DTC brands in 2026.
Where did the money go? Ads, discounts, shipping, tools, payroll – suddenly that “growth month” feels more like a loss.
That’s the trap too many DTC brands fall into: chasing revenue while ignoring profit. And in 2026, with rising CACs and tighter capital, it’s a trap that can kill your business.
And here’s the kicker: if you’re building toward a sale, acquirers won’t value you on revenue. They’ll value you on a multiple of your profit. (See H1 2025 eCommerce Valuation Webinar – The Fortia Group for a deep dive.)
The brands that thrive this year won’t be the ones bragging about top-line sales. They’ll be the ones with crystal-clear visibility into profitability – and the discipline to scale it.
In this guide, we’ll break down why profitability tracking matters, the pitfalls ecommerce brands face, the key metrics you need to monitor, and how to track them effectively with the right tools.
Why Profitability Tracking Matters in 2026
Most ecommerce brands obsess over revenue. But revenue alone doesn’t keep the lights on. Investors, partners, and even your own team care about profitability — because that’s what fuels sustainable growth and drives valuations.
Here’s why tracking profit is critical:
- Cash flow clarity – understand whether your sales are actually putting money in the bank.
- Smarter decisions – allocate budget to channels, campaigns, and products that drive incremental profit, not just vanity revenue.
- Investor readiness – whether raising or exiting, profitability metrics are now deal-breakers.
- Survival in 2026 – with rising ad costs and tighter capital, profitability-first brands are the ones that scale.
Revenue ≠ Profit: Common Pitfalls Merchants Face
For years, ecommerce was fueled by a single obsession: growth at all costs. Investors rewarded brands for steep revenue charts, and cheap capital made it easy to paper over losses. If you could show sales climbing, you could raise money, hire fast, and scale.
That mindset worked in an era of low CACs, low interest rates, and a “land grab” mentality. Founders were effectively told: “Don’t worry about profit – just grow, and it’ll all make sense later.”
But 2026 is a very different landscape. Ad costs are rising, consumer loyalty is fragile, and investors (and acquirers) now demand proof of profitability. The metrics that once dazzled on a pitch deck no longer pass scrutiny.
And yet, too many founders are still focused on ROAS, celebrating revenue from ads — while being unable to clearly talk about profit. ROAS might show you sales growth, but it hides the real story: whether those sales are actually making you money. (See The Problem with ROAS: why it’s blocking your Shopify growth for a deeper dive.)
It’s easy to mistake sales growth for success, but many ecommerce brands discover too late that their top-line revenue hides bottom-line pain.
Here are the most common pitfalls:
- Ignoring true CAC – In the growth era, brands blended first-purchase CAC with returning customers to make acquisition costs look lower. In reality, new customer acquisition is getting more expensive by the quarter, and hiding it distorts profitability.
- Overestimating LTV – Decks were built on inflated lifetime value assumptions. But today’s consumers are fickle: subscriptions are canceled, inboxes are full of discounts, and churn is higher than ever. Banking on every customer coming back is a recipe for disappointment. Check out our blog on How to Measure Customer Lifetime Value: Calculate CAC Payback & Scale Profitably
- Misallocating overhead – Rent, salaries, SaaS tools, and ops costs rarely made it into “profitability” models. Yet these fixed costs can erode margin faster than you realize. Without allocating them properly, your P&L is incomplete.
- Contribution margin confusion – Many founders stop at gross margin, which only looks at revenue minus COGS. On paper, a 60–70% gross margin can look great. But gross margin ignores the real variable costs of running an ecommerce business: fulfillment, shipping, returns, payment processing fees, discounts, and, most importantly – ad spend.
Once those are factored in, your contribution margin often tells a very different story. What looked like a healthy business at the gross margin level can suddenly shrink to single digits — or even go negative — once you account for the true cost of getting products into customers’ hands.
For a step-by-step breakdown of how to calculate contribution margin (with formulas and examples), check out our Contribution Margin Formula Guide
Key Metrics Every DTC Brand Should Track
Profitability tracking isn’t about drowning in dashboards, it’s about focusing on the few numbers that actually tell you if you’re making money. Too many brands get stuck in vanity metrics like sessions, followers, or even “average order value,” without ever connecting them to actual profit.
If you’re not sure which numbers truly move the needle, we’ve broken it down in our guide on the 7 Key Metrics Every Ecommerce Dashboard Should Have.
Here are the non-negotiable profitability metrics for DTC in 2026:
Customer Acquisition Cost (CAC)
The all-in cost of acquiring a new customer, broken down by channel.
- Why it matters: CAC determines how efficiently you’re turning marketing spend into customers. If your CAC creeps up but your LTV stays flat, your business model breaks fast.
- 2025 reality: Paid social costs are rising, privacy changes limit tracking, and blended CAC numbers are misleading. You need to separate first-purchase CAC from returning customer spend to avoid lying to yourself.
- Operator tip: Track CAC by channel, not just blended. And benchmark CAC payback periods, how quickly does a new customer become profitable?
Lifetime Value (LTV)
The revenue (ideally, contribution margin, not just sales) a customer generates over their lifecycle.
- Why it matters: LTV tells you how much you can afford to spend on CAC. It’s the other half of the “CAC vs LTV” equation every investor and operator looks at.
- 2026 reality: Old LTV models assumed customers stuck around for years. In today’s crowded market, churn is higher, and true LTV often comes in lower than expected.
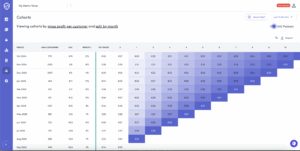
- Operator tip: Measure 12-month LTV rather than a 3- or 5-year projection. And always tie it to contribution margin, not gross revenue, to avoid inflating the number.
Contribution Margin
Revenue minus variable costs: COGS, shipping, discounts, returns, payment processing fees.
- Why it matters: This is the true profit per order before fixed costs. If the contribution margin is weak, scaling only amplifies losses.
- 2026 reality: Discounts and free shipping erode contribution margins silently. A brand with 70% gross margin can still have a sub-30% contribution margin after these costs.
- Operator tip: Track contribution margin at both product level and channel level. Some SKUs may be profit killers, even if they are top sellers.
Gross Margin % vs Net Margin %
- Gross Margin %: Revenue minus full COGS (product, packing, shipping, 3PL & transaction fees).
- Net Margin %: What’s left after all costs (variable + fixed).
- Why it matters: The gap between these two tells you how efficiently you’re managing both operations and overhead.
- 2026 reality: Many brands celebrate “healthy gross margins” while quietly running negative net margins. Investors see through this instantly.
- Operator tip: Report both — side by side — to keep yourself honest and to show investors a complete picture.
Tools for Ecommerce Profitability Tracking: Manual vs Dashboards vs StoreHero
There are three main approaches to tracking ecommerce profitability:
1. Manual (Spreadsheets)
Pros: Free, customizable.
Cons: Time-consuming, error-prone, quickly outdated.
Spreadsheets are fine for an early-stage brand, but once you’re running multiple channels and SKUs, manual tracking becomes unsustainable.
2. Dashboards (Attribution / Analytics Tools)
Pros: More automation, real-time data.
Cons: Most focus on attribution (where revenue comes from) not profitability (what’s left after costs).
Platforms like Triple Whale and Northbeam help with attribution, but they don’t solve the profitability question.
3. Profitability-Focused Platforms (StoreHero)
Pros: Designed specifically for ecommerce profitability tracking
Cons: Requires setup — but pays off fast.
StoreHero is a Shopify app for ecommerce profitability tracking. It pulls your revenue, costs, marketing spend, and overhead into one dashboard so you can see real profit per channel, customer, and cohort — without needing a finance degree.
👉 Try StoreHero’s Profit Tracking App for Shopify
StoreHero: The Shopify Profit Tracking App
Running a DTC brand is complex. Tracking profitability shouldn’t be.
With StoreHero, you get:
- One-click Shopify integration
- Automated cost + overhead allocation
- Real-time CAC, LTV, and contribution margin tracking
- Profit dashboards for channels, cohorts, and products
- Clear, actionable insights (not just data dumps)
👉 Install the StoreHero Profit Tracking Shopify App