
In the ever-changing world of ecommerce, every second counts. Founders, managers, and operators are constantly making high-stakes decisions to scale profitably and drive sustainable growth for their stores. But too often, they’re stuck sifting through outdated spreadsheets, juggling multiple disconnected sheets, or waiting for incomplete monthly reports. A smart, intuitive ecommerce dashboard can change everything—giving you real-time insights and the clarity to take immediate, impactful actions. In this guide, we’ll break down the must-have ecommerce metrics top brands rely on every day to scale efficiently and maximize profitability.
THE 7 KEY SANITY METRICS YOU NEED TO TRACK IN YOUR ECOMMERCE DASHBOARD
There are countless metrics you could track, but after analyzing over 400+ ecommerce dashboards at StoreHero, we’ve pinpointed the most critical ones that top brands use every single day. These metrics help brands focus on what matters most, ensuring they can track their profitability and scale their ecommerce business efficiently. We’re not saying you shouldn’t track other metrics, but if you want a strong foundation, these should definitely be in your toolkit.
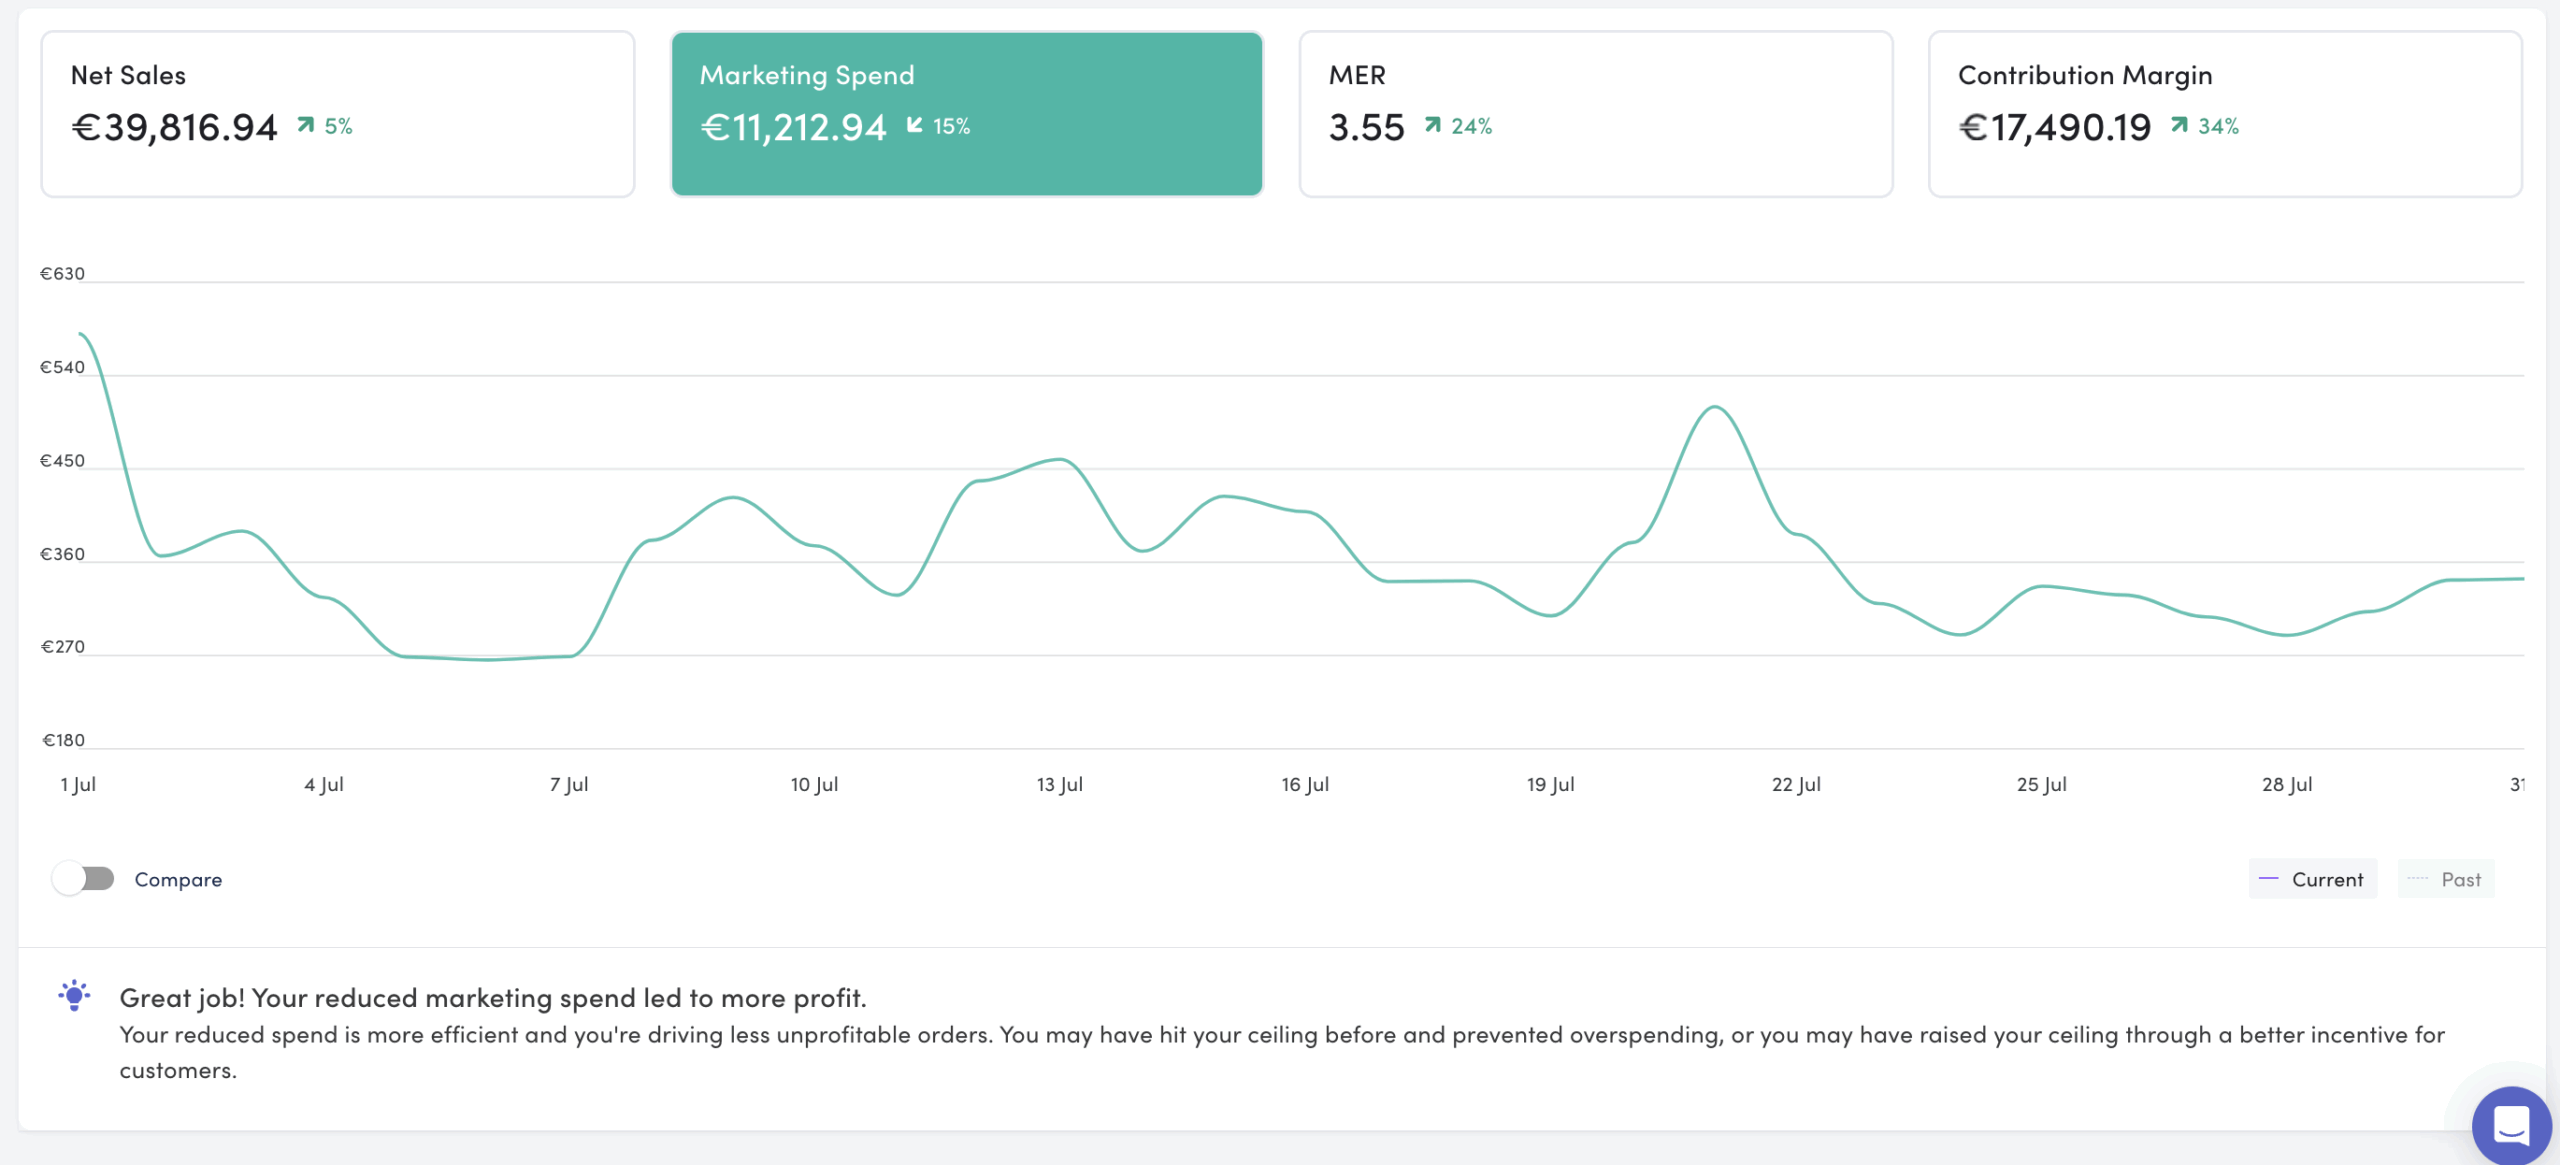
1. Contribution Margin
This should be, without doubt, your North Star in your dashboard! Contribution Margin measures the profit remaining after deducting variable costs such as shipping, packaging, and production. In other words, this ecommerce metric gives you the real profit after accounting for all expenses directly tied to your product.
Contribution Margin Formula = Net Sales – COGs – Marketing Spend
You can use this calculator to know your contribution margin.
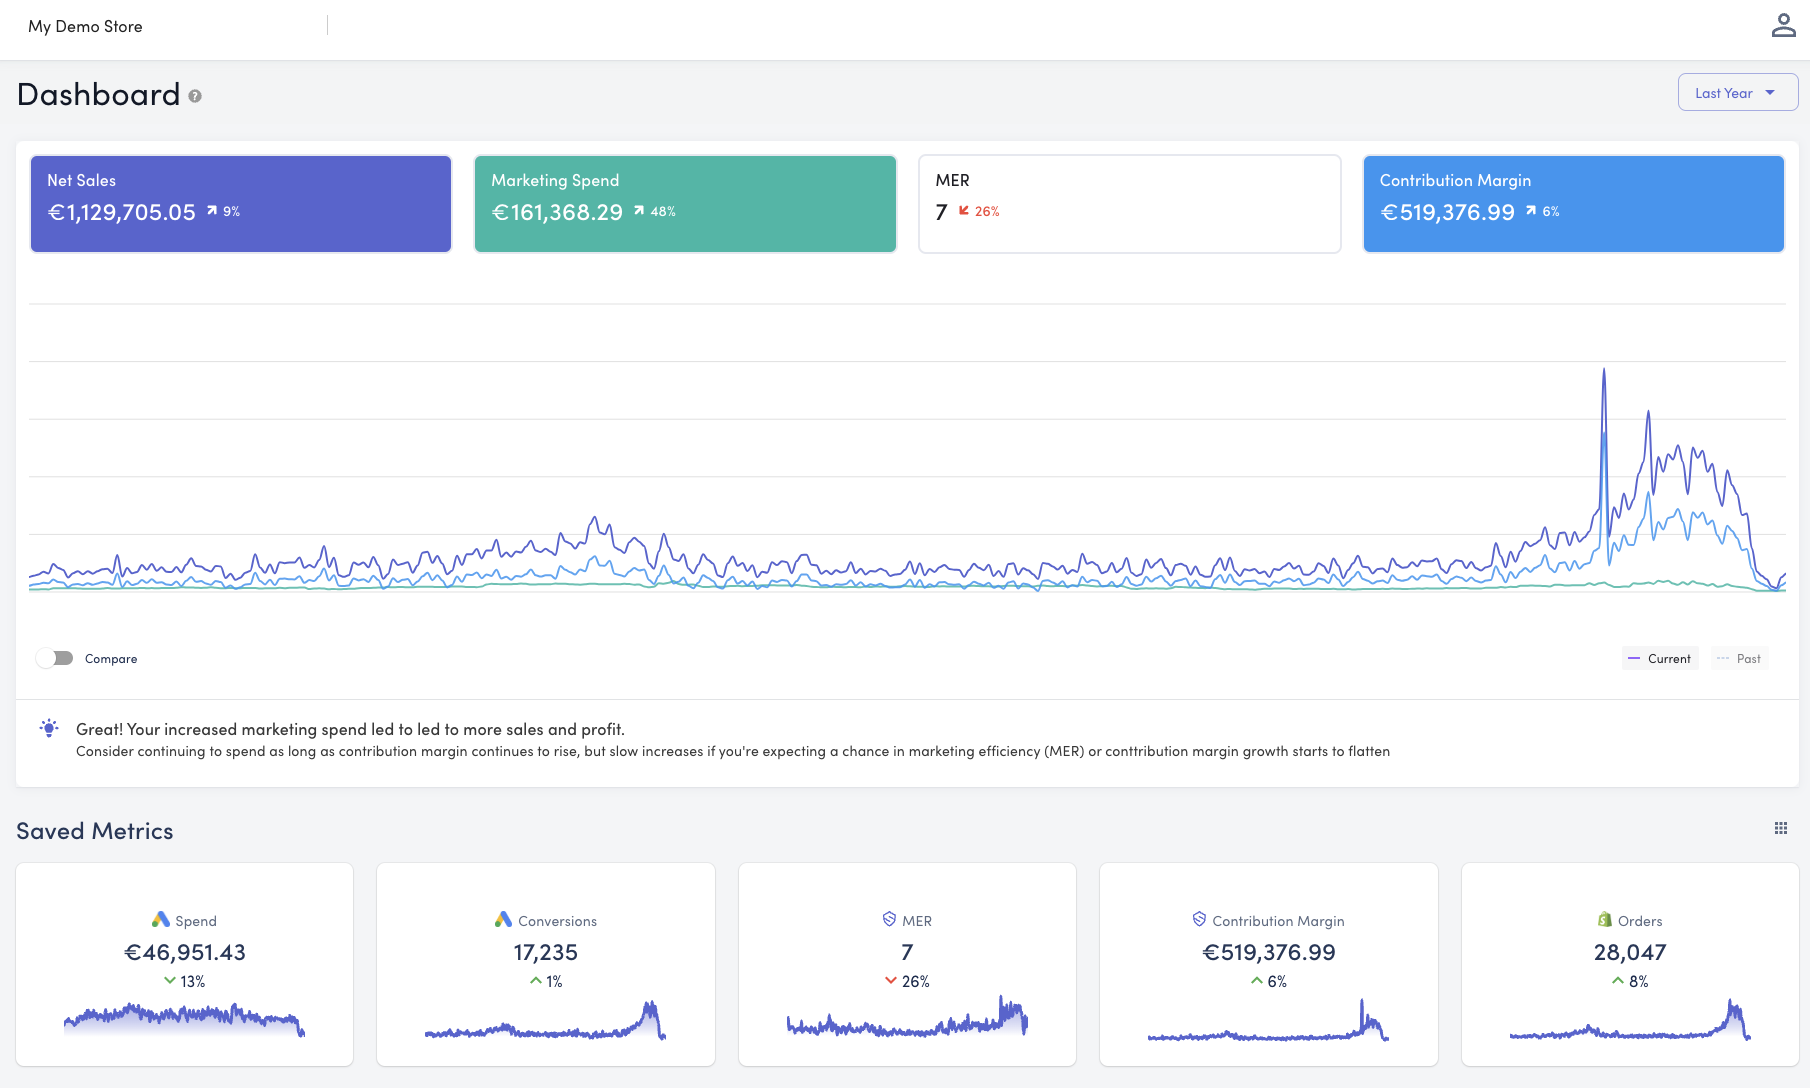
2. Net Sales
It represents the total revenue from sales after deducting returns, discounts, and allowances. While it doesn’t directly reveal profitability, Net Sales provides a clear top-line overview that serves as a foundation for understanding the next metrics like Contribution Margin and Net Profit.
3. Marketing Spend
This metric tracks all expenditures on marketing activities, from ad campaigns to email promotions. It’s essential for understanding where your resources are allocated and ensuring that your marketing investments contribute effectively to overall profitability.
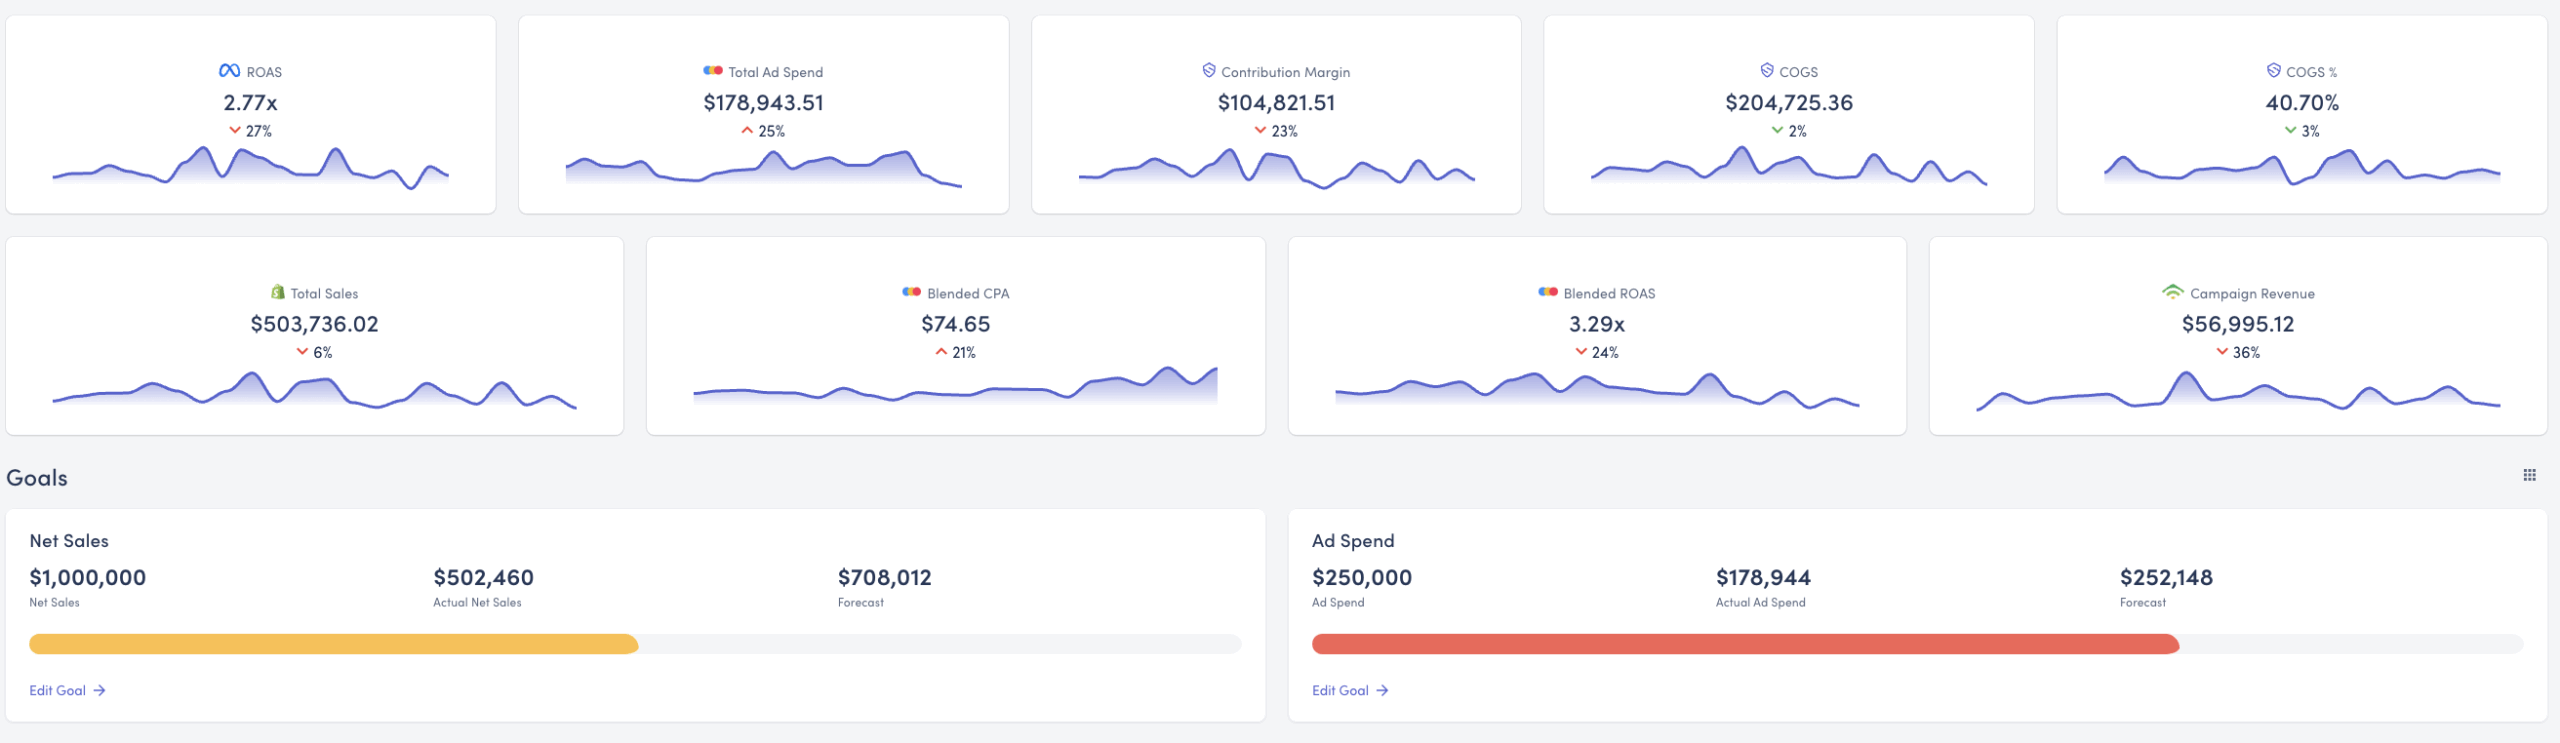
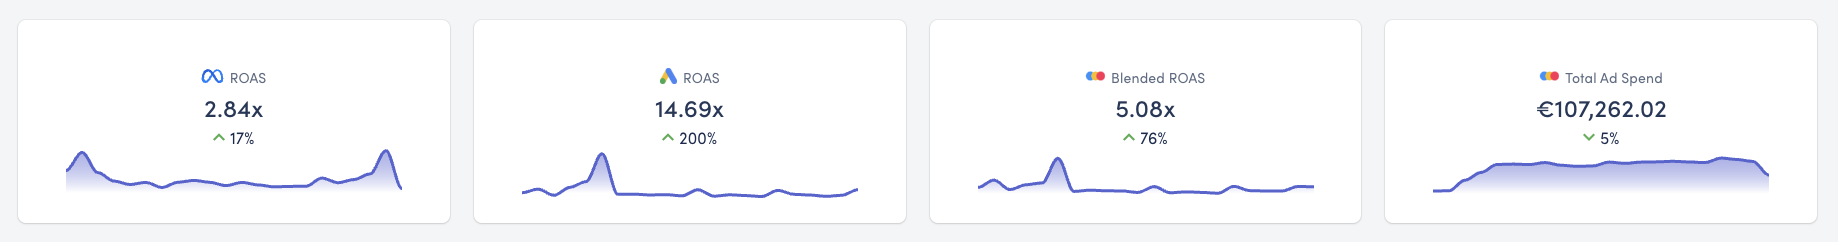
4. Ad Spend
Some brands include ad spend within their broader marketing spend, which is a valid approach. However, breaking down how much budget is specifically allocated to individual advertising platforms provides deeper insights into your marketing strategy. If you are running ads on more than one social media platform, consider tracking individual metrics for each channel or maintaining a global overview to monitor overall performance effectively.
5. Marketing Efficiency Ratio (MER)
MER compares your total revenue to total marketing spend, giving you a broad perspective on how efficiently your marketing budget is being utilized. It’s not just about tracking efficiency—it’s about setting a baseline for sustainable growth. Understanding your break-even MER is equally important, as it defines the absolute maximum you can spend on marketing before your business starts losing money. This insight is invaluable for aligning your marketing strategy with profitability and ensuring long-term success. A must in any ecommerce dashboard.
Learn more about good, bad MER and how to improve it here.
6. New Customer Metrics
Understanding the metrics tied to new customers is essential for evaluating acquisition strategies, optimizing profitability, and driving sustainable growth. These metrics provide insights into how effectively you’re converting new customers and whether they’re contributing to your bottom line.
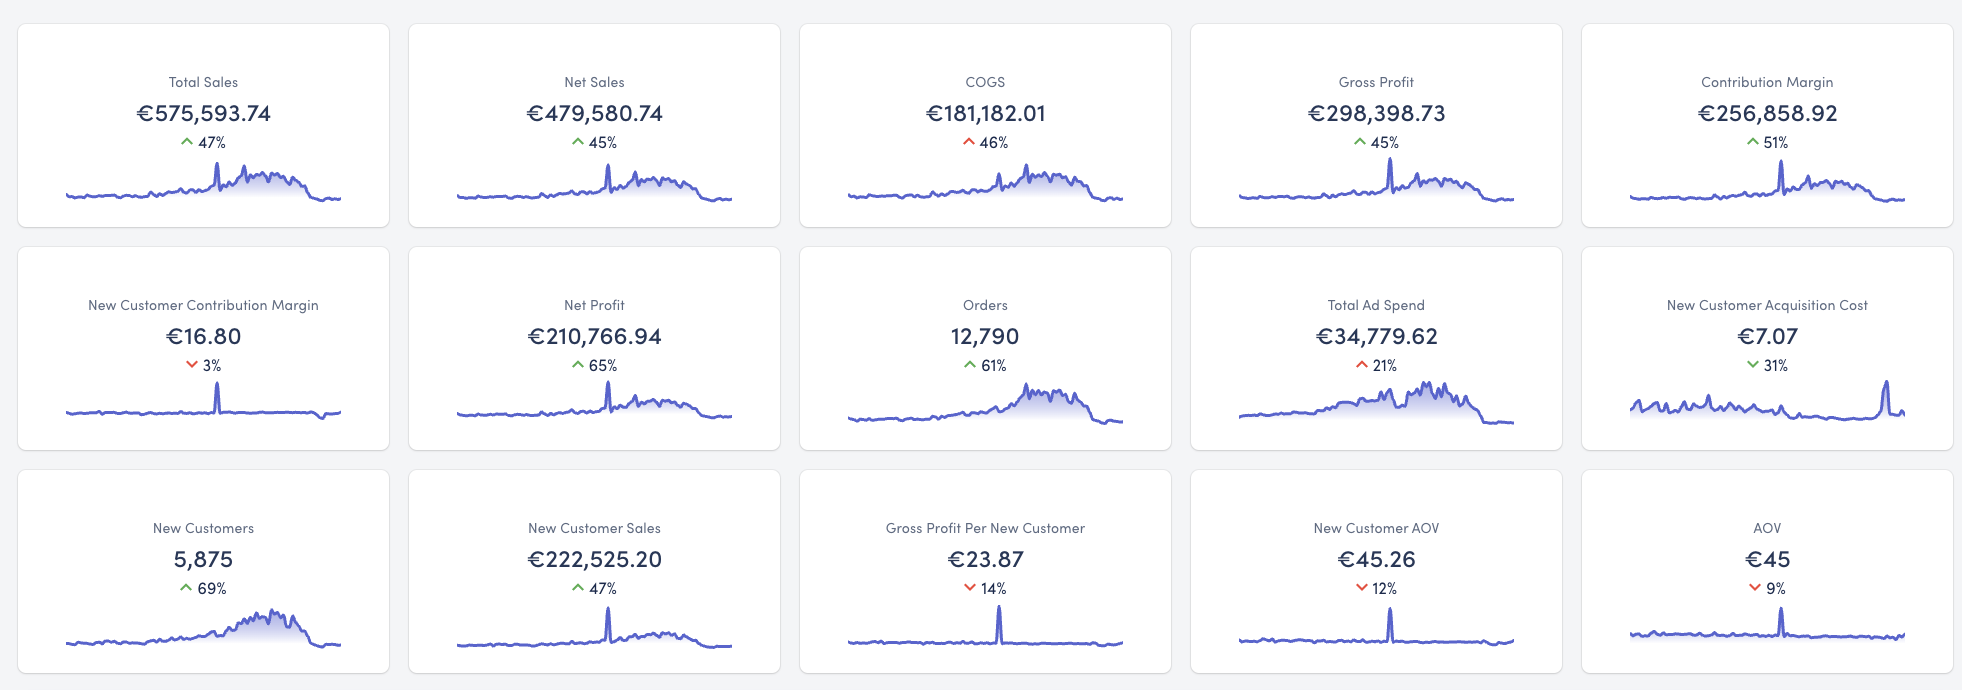
New Customer Sales
This metric separates revenue generated by new customers from that of repeat customers. It’s a crucial indicator of acquisition success, showing if your growth is driven by new acquisitions or returning customers. By tracking new customer sales, you can spot opportunities to scale smarter and refine your acquisition strategies.
Average Order Value (AOV) of New Customers
AOV shows how much new customers are spending per order. If AOV is low, profitability can take a hit, especially if acquisition costs are high. Keeping an eye on this metric helps you understand whether new customers are buying high-margin or low-margin products. If AOV for new customers is below target, try upselling, cross-selling, or bundling to increase their order value.
Customer Acquisition Cost (CAC) for New Customers
CAC tells you how much it costs to bring in a new customer. It’s all about balance if CAC is too high, your marketing efforts might need a closer look. On the flip side, a low CAC paired with strong sales suggests an efficient and strong acquisition strategy. Regularly monitoring CAC ensures your marketing spend is optimized for profitable growth.
Profitability on First Orders from New Customers
Are you making money on that first purchase, or are you relying too heavily on repeat business? First-order profitability is critical for businesses that don’t see frequent repeat purchases (think furniture or seasonal products). If you’re not profitable on first orders, it might be time to revisit your pricing, marketing spend, or product mix.
Contribution Margin for New Customer Orders
We started this post emphasizing the importance of Contribution Margin as your North Star metric, and now let’s zoom in on its role specifically for new customer orders. Contribution Margin measures the profit left after accounting for variable costs like shipping, production, and transaction fees. It’s the ultimate test of whether new customer orders are truly adding value to your business.
A low or negative contribution margin for new customers signals that something needs to change—whether it’s pricing, cost management, or strategies to boost AOV. Keeping this metric in check ensures your acquisition efforts are not only driving growth but also contributing to profitability.
7. Repeat Customer Metrics
Now that you’re tracking your new customers, it’s just as important to monitor the value and behavior of your existing ones. Repeat customers often account for the most profitable segment of your business due to lower acquisition costs and higher loyalty. By analyzing these metrics, you can refine retention strategies, boost profitability, and ensure sustainable growth by maximizing the potential of your existing customer base.
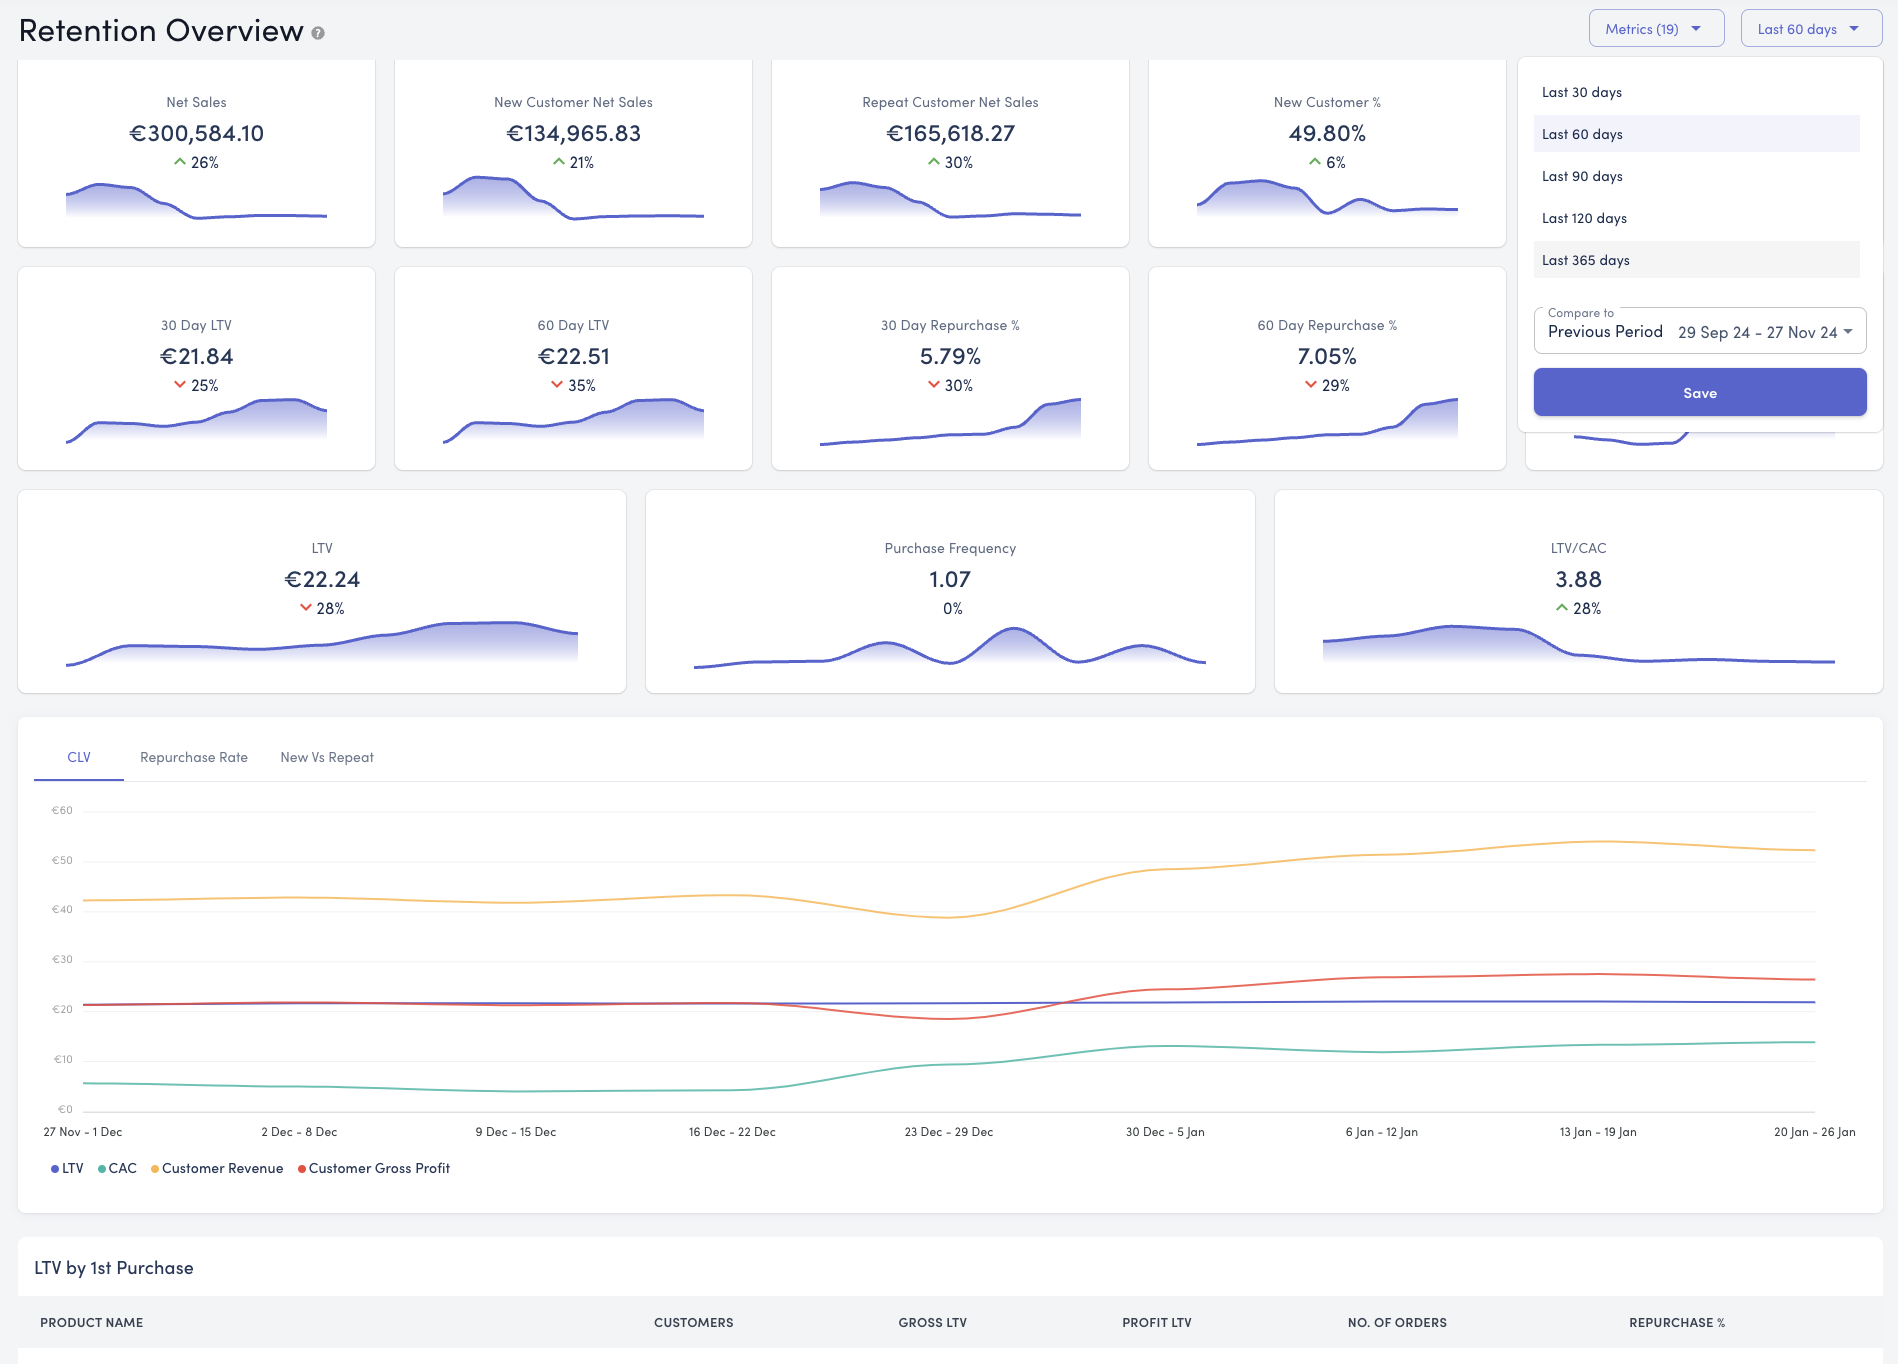
Repeat Customer Sales
We’ve talked about the importance of new customer sales, but when it comes to profitability, repeat customers are the real MVPs. This metric measures the revenue generated by returning customers and helps you assess loyalty and long-term sustainability.
📈 A high percentage of repeat customer sales indicates strong retention.
📉 While a low percentage signals a need for improved customer engagement.
Number of Repeat Customers
Retaining customers is often more cost-effective than acquiring new ones, making this metric key to growth. Tracking the total number of repeat customers shows how effectively your business keeps customers coming back. A decline in this number might highlight issues with customer experience, product satisfaction, or your retention strategies.
Frequency of Repeat Purchases
Frequency tells you how often customers return to buy from you over a specific period. Maximizing repeat purchases is critical for increasing customer lifetime value (LTV) and overall profitability. Spotting patterns in repeat purchase frequency allows you to implement retention strategies like loyalty programs or subscription models to encourage more frequent orders.
Average Order Value (AOV) of Repeat Customers
AOV for repeat customers reflects the monetary value of their orders. Repeat customers typically cost less to market to, meaning higher AOV among them significantly boosts profitability. If repeat customer AOV is stagnant or decreasing, upselling, cross-selling, or targeted campaigns can be great strategies to drive higher spending.
If you want to discover new tools and tips to improve your AOV, watch this episode for actionable insights.
Lifetime Value (LTV) of Repeat Customers
Lifetime Value measures the total profit a customer generates throughout their relationship with your brand. It’s a critical metric for determining how much to invest in acquiring and retaining customers.
Higher LTV allows businesses to spend more on acquisition without sacrificing long-term profitability. Using cohort analysis can help track LTV growth and inform retention strategies.
Profitability of Repeat Customer Orders Over Time
Tracking the profitability of repeat customer orders shows how much profit is generated from returning customers after deducting variable costs. Repeat customers often become more profitable over time due to lower acquisition costs and stronger purchasing behavior. If profitability from repeat customers is low, focus on increasing margins through pricing adjustments, cost reductions, or encouraging higher AOV.
5 ESSENTIALS FOR YOUR ECOMMERCE DASHBOARD
The metrics are the core of the dashboard, but its design and usability also make a huge difference in how effective it will be. Here are five traits every high-impact ecommerce dashboard should have:
- Clear and Easy to Understand: Your dashboard should provide at-a-glance insights, using visuals like color-coded graphs, clear filters, or charts that highlight key comparisons. The less time you spend interpreting data, the better your decision-making will be.
- Real-Time Data or Frequent Updates: Outdated information leads to delayed decisions. Your reporting file should offer real-time or near-real-time updates to help you avoid costly delays, spot inefficiencies immediately, and stay ahead of operational changes.
- Customizable Views: Every business is different. Make sure your dashboard allows you to prioritize the metrics that matter most to your goals and operations.
- Centralized Data Integration: A great platform consolidates data from all key platforms (Shopify, Meta, Google Ads, etc.) so you don’t waste time switching between tools and piecing together fragmented information. If you can have one unified dashboard, believe us, it will make the difference.
- Profit-Focused Insight: Beyond vanity metrics like clicks and impressions, your dashboard should highlight key profit drivers. These insights empower you to focus on what truly impacts your bottom line.
Your ecommerce dashboard is more than just a collection of numbers; it’s your command center for profitable growth. By focusing on the key ecommerce metrics outlined above, you can gain clarity, make informed decisions, and avoid costly mistakes.
At StoreHero, our AI-powered ecommerce dashboards are designed to centralize your marketing and finance data, giving you real-time insights that drive profitable growth. You can try it for Free during 14 days. Book a live demo with us!
Don’t leave your success to chance. Start tracking the right metrics today and empower your business to scale smarter, faster, and more profitably.