
Introduction
Many direct-to-consumer (DTC) brands today struggle with rising advertising costs, shrinking margins, and uncertainty around attribution. Common metrics such as Return on Ad Spend (ROAS) or Marketing Efficiency Ratio (MER) provide some insight, but they rarely give the full picture.
This is where contribution margin comes in. While lesser-known to newer operators, it’s the metric that the most sophisticated ecommerce brands and agencies rely on to make day-to-day decisions. Contribution margin takes into account all variable costs (COGS) — not just ad spend, and provides the clearest possible measure of whether your sales are actually profitable.
What Is Contribution Margin?
Contribution margin is simply net revenue minus all the variable costs in your business — things like product costs, shipping, payment fees, and advertising.
For ecommerce brands, this number is the truth serum. It shows if every sale is actually moving you closer to profit — or just growing top-line revenue while cash bleeds out the back door.
Variable costs typically include:
Cost of Goods Sold (COGS)
Fulfillment and shipping
Packaging
Transaction and payment processing fees
Advertising and promotional expenses
This figure represents how much profit each unit of sale contributes toward covering fixed costs (like salaries, rent, and software) and ultimately generating net profit.
Contribution Margin Formula:
Contribution Margin vs. Gross Margin
Many ecommerce founders confuse contribution margin with gross margin. The difference is in what costs are included:
Gross Margin → Revenue minus product costs (COGS).
Contribution Margin → Revenue minus all variable costs (product, shipping, fees, marketing, etc.).
Gross margin can make a product look profitable. But once you include shipping, fulfillment, and ads, contribution margin often shows the real story — sometimes a loss.
The Three Levels of Margin
Think of ecommerce profitability in three layers:
1. CM1 (Gross Margin 1 / Product Margin)
- Revenue – COGS
- Only product costs are included.
- Common starting point, but too simple on its own.
2. CM2 (Gross Margin 2 / Cost of Delivery)
- Revenue – (COGS + shipping + 3PL + transaction fees + packaging + returns)
- Includes all costs to deliver the product, except marketing.
- Much closer to reality for ecommerce.
3. CM3 (Contribution Margin)
- Revenue – (COGS + fulfillment + packaging + fees + returns + marketing)
- Includes marketing spend (ad costs, sometimes agency/influencer fees too).
- Gives the clearest picture of profitability.
Why It Matters
- CM1 = Are my products priced well vs. COGS?
- CM2 = Can I deliver the product profitably?
- CM3 = Am I acquiring customers profitably after ads?
Many brands stop at CM1 and overestimate their margins. The smartest operators track CM3 daily to understand true profitability and scale sustainably.
Example of Contribution Margin
Consider an ecommerce brand selling sneakers for €100:
- Net Revenue: $100
- COGS: $35
- Shipping & packaging: $8
- Transaction fees: $3
- CAC: $20
Contribution Margin = $100 – ($35 + $8 + $3 + $20) = $34
This means that for every $100 sale, $34 is available to cover fixed expenses and profit.
Why Contribution Margin Matters for Ecommerce
Contribution margin is more than just another financial metric. It’s the clearest way to see if your sales are actually profitable, because it accounts for all variable costs — not just product and shipping, but also marketing, fees, and fulfillment.
- ROAS shows revenue efficiency but ignores costs.
- MER gives a big-picture view but hides product-level profitability.
- Contribution Margin cuts through the noise, showing exactly what’s left over to cover operating expenses and generate profit.
The “Wall of Opex”
Think of operating expenses (OPEX) — salaries, software, rent — as a fixed wall.
Every order adds contribution margin, helping you climb that wall. Once you generate enough to clear it, everything above becomes net profit.
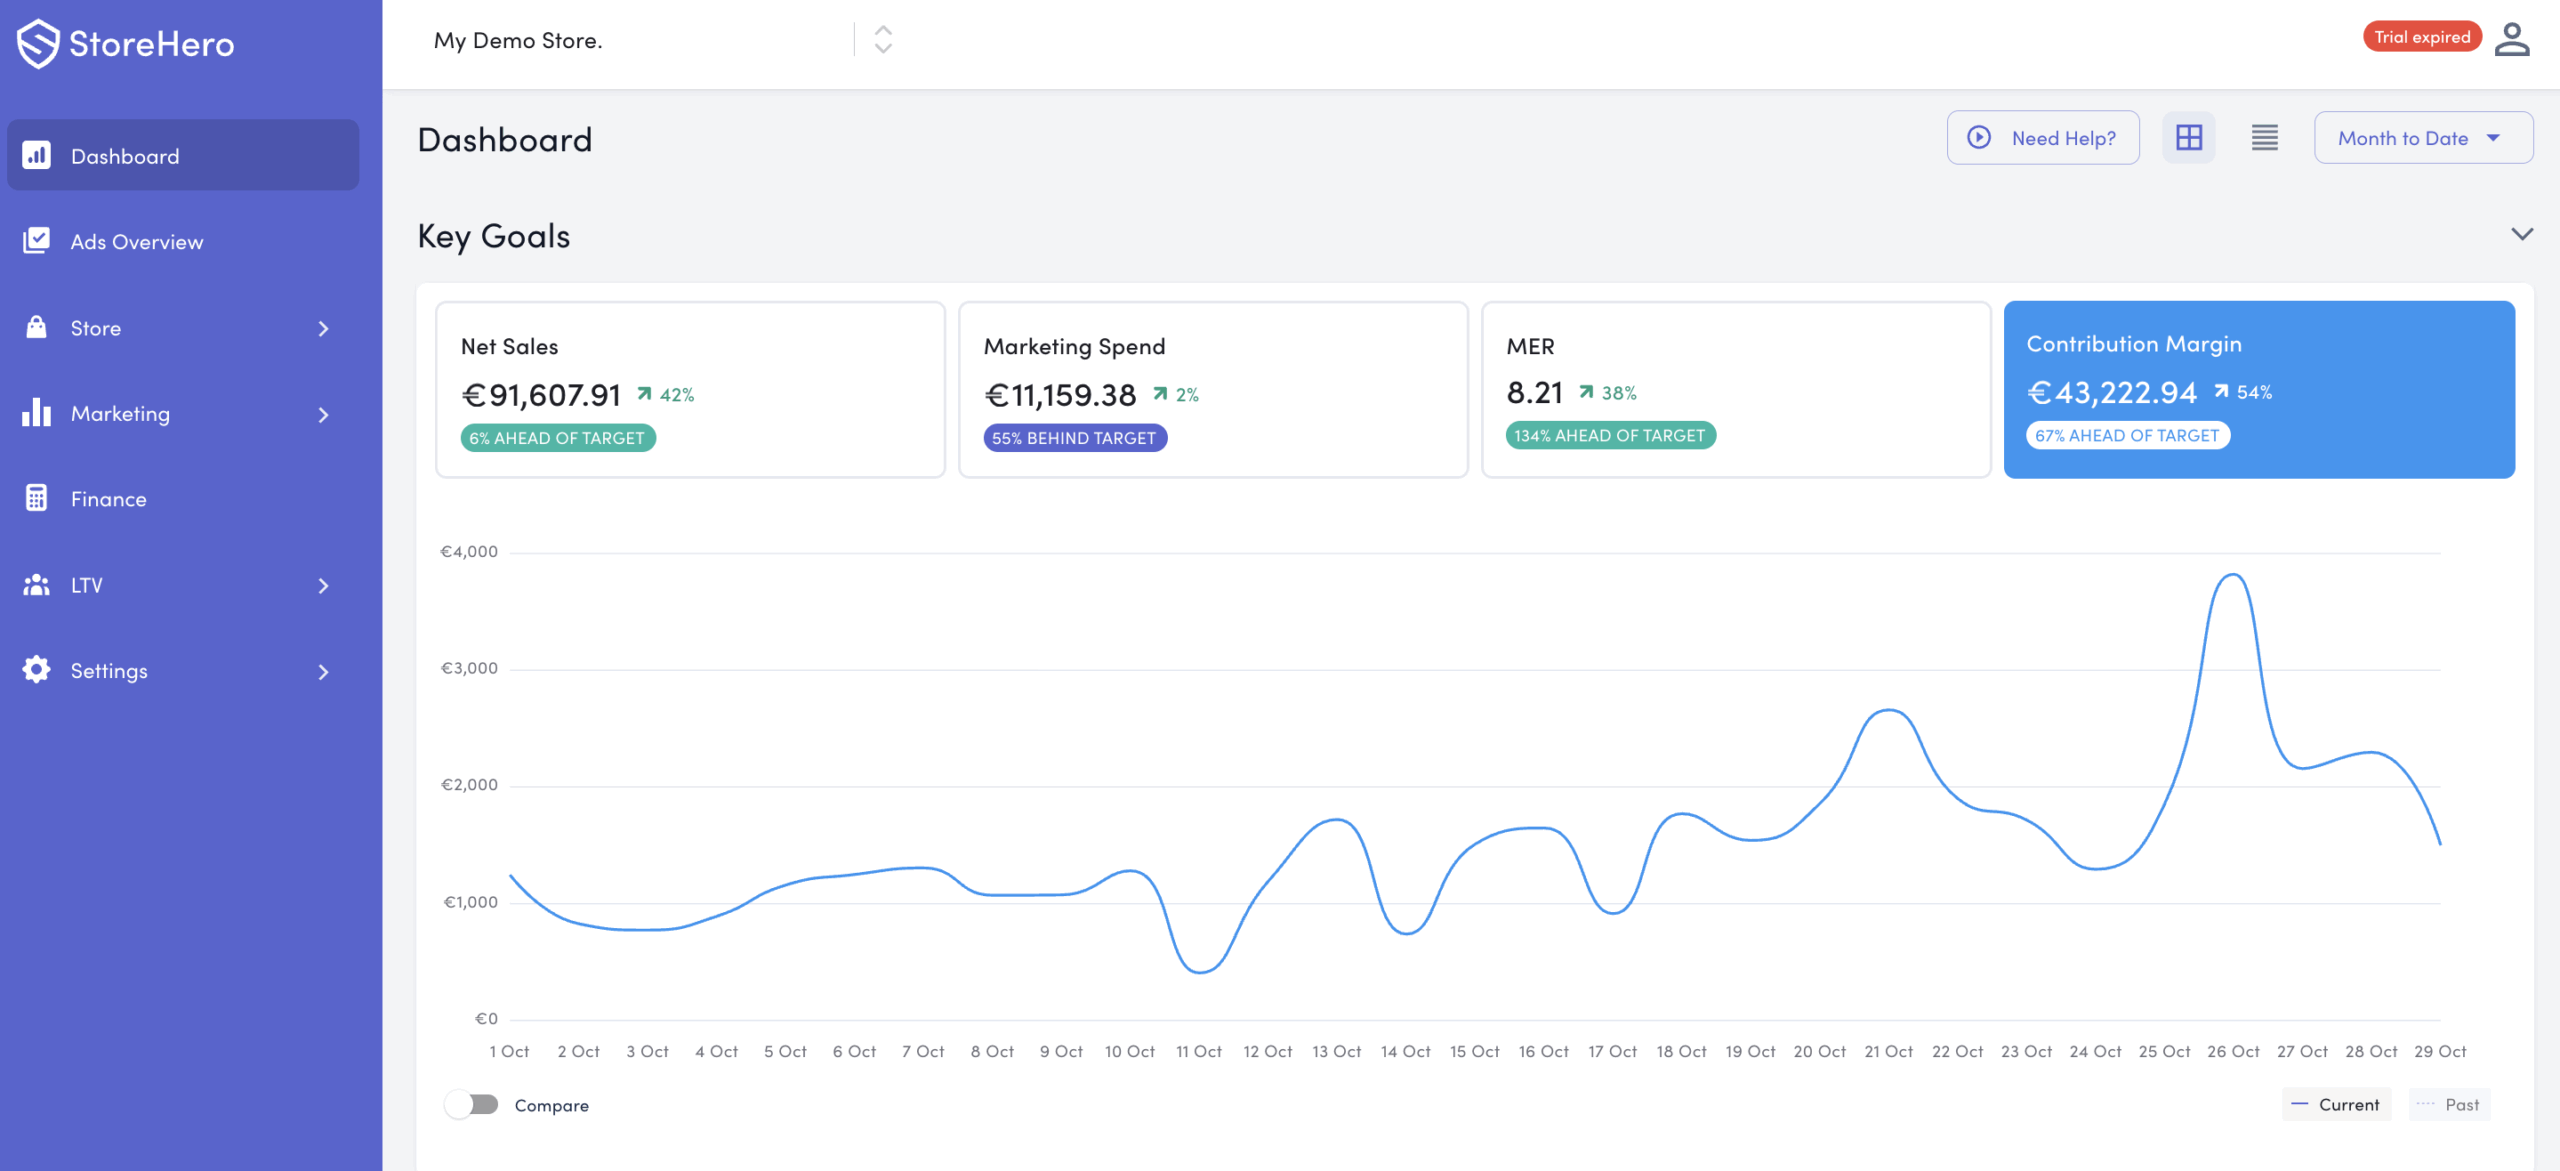
Here’s a real-world example from StoreHero’s Finance dashboard 👇
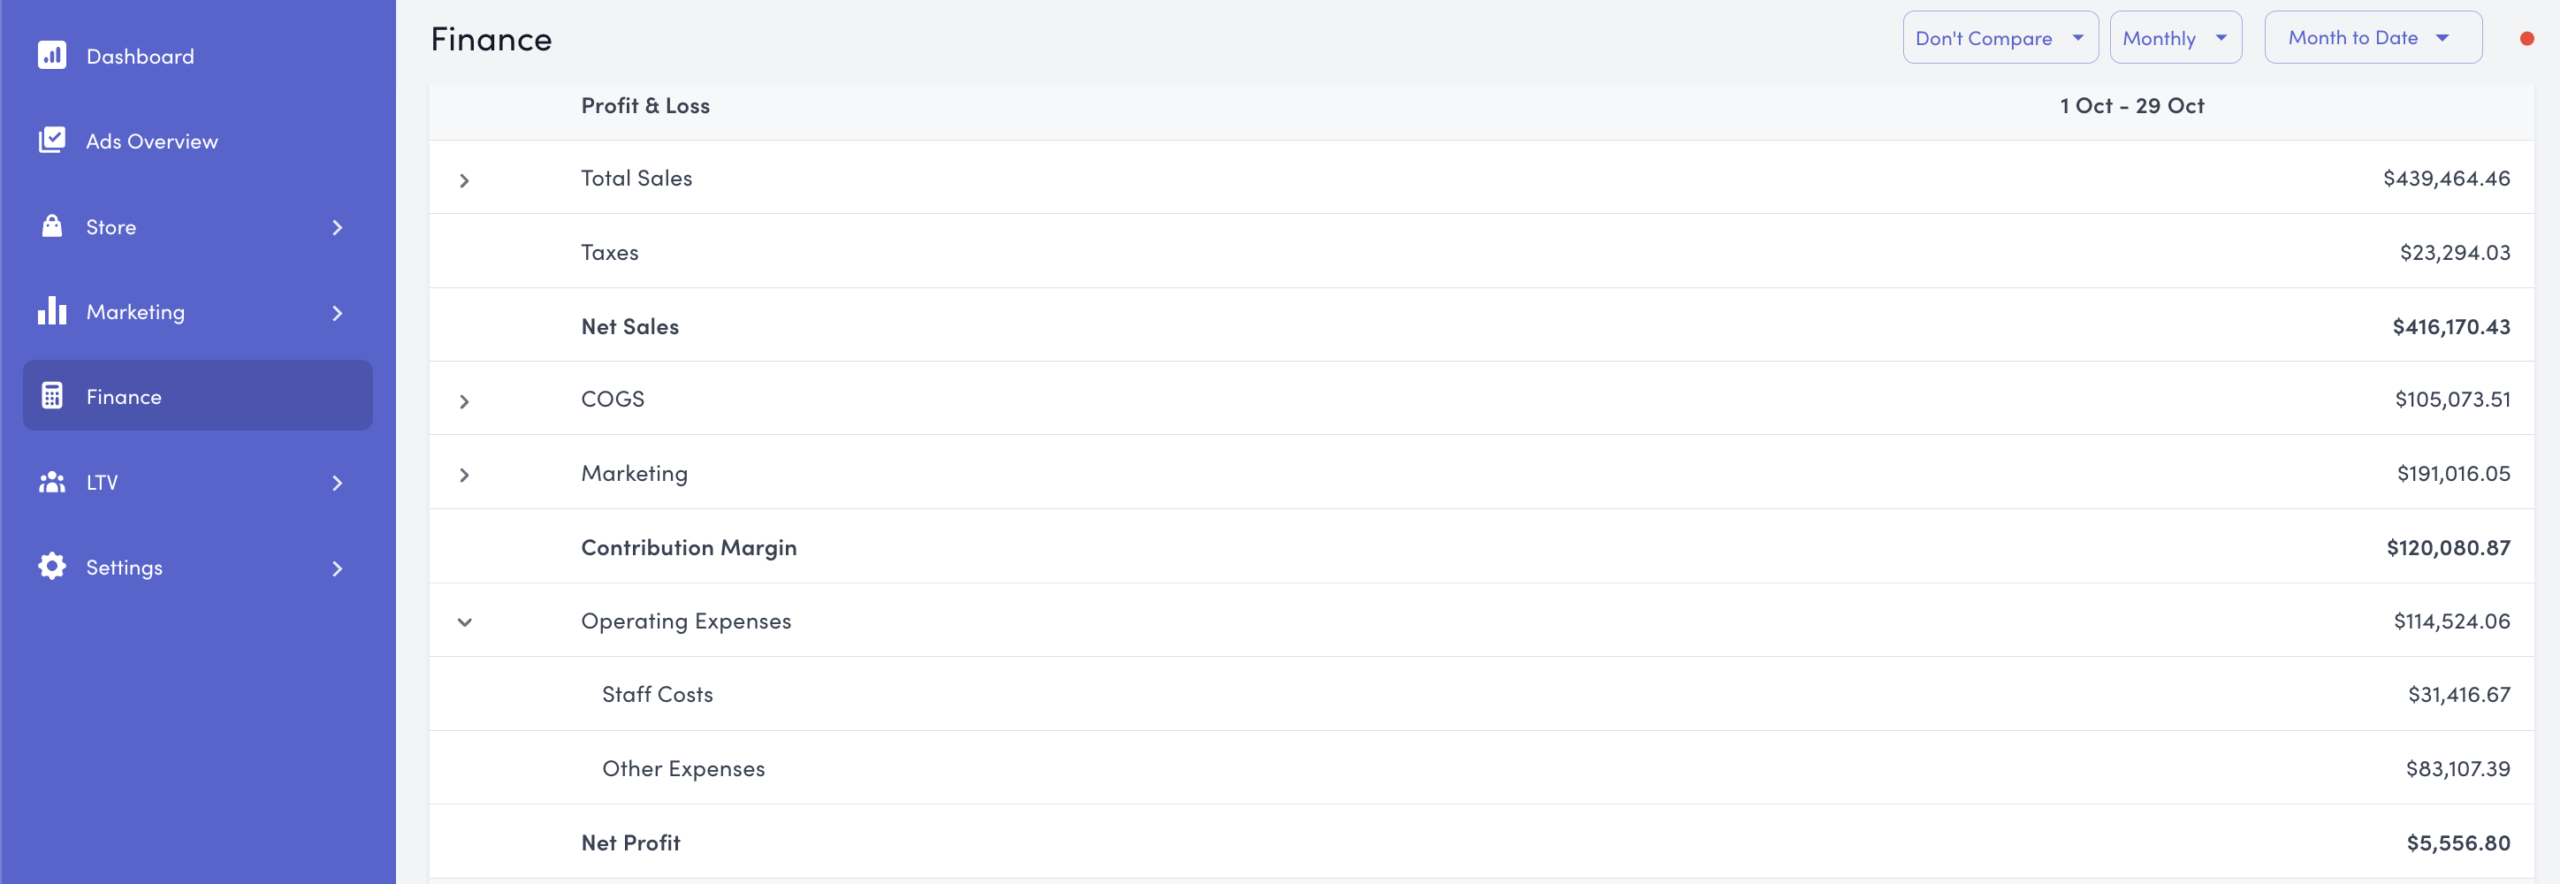
This makes the flow crystal clear:
Contribution Margin – Operating Expenses = Net Profit
It’s why the fastest-growing ecommerce brands obsess over contribution margin. Revenue can scale forever, but OPEX grows much slower — once you’re over the wall, profit compounds fast.
Why the Best Brands Focus Here
All of the biggest ecommerce brands, and the smartest agencies, are laser focused on contribution margin. Scaling revenue is not hard if we’re willing to overspend on ads, the art is in scaling the profit of the business.
In other words:
- Revenue can grow without profit.
- ROAS can look great while you’re still burning cash.
- But contribution margin shows you when growth is sustainable – and when it isn’t.
🎥 Watch Karl & Thomas explain it here:
“Contribution margin is the profit that each order contributes after marketing costs. It’s a better North Star for running the business with a profit orientation.”– Karl O’Brien, StoreHero Co-Founder
Benchmarks: What Is a Good Contribution Margin?
What’s a good contribution margin? It depends on your category:
- Food & Beverage: 20–40% (low margins are normal)
- Beauty & Supplements: 60–80% (higher margins possible)
- Fashion & Apparel: 50–70% (varies with returns & logistics)
As a rule of thumb, if you’re scaling paid ads, you should target at least 35% contribution margin. That leaves enough room to cover OPEX and still generate net profit.
Why Contribution Margin Beats ROAS & MER
For years, ecommerce brands have leaned on ROAS (Return on Ad Spend) and MER (Marketing Efficiency Ratio) to measure success. The problem? Both can look great while you’re quietly losing money.
- ROAS only measures revenue per ad dollar. It ignores COGS, shipping, returns, and fees.
- MER lumps all revenue vs all ad spend. It hides unprofitable products and channels.
Contribution margin fixes both by showing the actual profit left after every variable cost.
A Simple Example
Two brands, same ROAS.
| Brand A | Brand B | |
|---|---|---|
| Revenue | $100,000 | $100,000 |
| Ad Spend | $25,000 | $25,000 |
| ROAS | 4.0 | 4.0 |
| COGS | $30,000 | $50,000 |
| Fulfillment & Fees | $10,000 | $15,000 |
| Contribution Margin | $35,000 | $10,000 |
Result:
- Brand A has lean costs → healthy contribution margin → profitable growth.
- Brand B has high COGS and expensive shipping → contribution margin thin → scaling at a loss.
👉 Same ROAS. Same revenue. But only contribution margin shows who’s really winning.
The Bottom Line
- ROAS can trick you. It rewards revenue growth, even if it’s unprofitable.
- MER is too blunt. It averages performance and hides problem SKUs.
- Contribution Margin is the truth. It tells you whether scaling ads is adding real profit, or just bigger top-line numbers.
This is why the most sophisticated DTC operators, and all the big brands you look up to, are laser-focused on contribution margin.
How to Improve Contribution Margin
Brands can take several steps to increase contribution margin:
- Pricing Strategy: Small price adjustments or bundling can raise margins without reducing conversion.
- Cost Management: Negotiate supplier terms, optimize packaging, or leverage 3PLs to reduce fulfillment expenses.
- Marketing Efficiency: Align advertising spend with profitability rather than pure revenue growth.
- Retention: Encourage repeat purchases to improve lifetime value (LTV), lowering the reliance on expensive customer acquisition.
👉 We go deeper into these strategies in our 3 Levers for Margin Expansion blog post.
Don’t just read about it — calculate it.
- Run the numbers with our Contribution Margin Calculator
- Watch our YouTube breakdown for a step-by-step guide
- Check out how Fior Scaled Contribution Margin by 1400% with StoreHero
Key Takeaways
- Contribution Margin = Net Revenue – All Variable Costs
- It provides a more complete view of profitability than ROAS or MER.
- Benchmarks vary, but DTC brands should aim for 50%+.
- Improving CM requires a mix of pricing strategy, cost reduction, efficient marketing, and retention.
- The most sophisticated ecommerce brands and agencies already use it as their primary growth metric.


Forget Multi-Touch Attribution: Why Profitability Is the Only Source of Truth for eCommerce Brands | StoreHero
October 19, 2025[…] Contribution margin – are you scaling profitably or burning cash? […]