How do I forecast ad spend for my ecommerce store?
For direct-to-consumer (DTC) brands, forecasting ad spend isn’t just about revenue, it’s about balancing CAC, gross margin, OPEX, and profit goals.
Time-consuming forecasts are a thing of the past. With StoreHero, you can build accurate forecasts in minutes, not days.
“Our team didn’t have time for a traditional forecasting exercise, so we turned to StoreHero. It took just five minutes. StoreHero forecasted our revenue and ad spend for the next six months to align with our profit goals. And guess what? StoreHero’s forecast was within two percent accuracy.”
Why is forecasting so hard in ecommerce?
If you’ve ever tried to set up a forecast for your ecommerce business, you’ll know the pain. There are too many moving parts, too many assumptions, and often too many people with different skill sets involved. Marrying finance, marketing, and operations together in one model usually feels like wrestling an octopus.
After speaking with a lot of our customers, one question kept coming up, “How do I forecast ad spend for my ecommerce store?” “Why use MER vs ROAS for forecasting?”
The feedback was clear:
“We’d love a way to get StoreHero to help us forecast quickly, so we can see where we’re on track, and more importantly, where we’re not.”
Another piece that was clear was, clients asking us – How do I figure out my marketing budget to stay profitable? How do I figure out my marketing budget to stay profitable? One of the hardest pieces to nail is how much to spend on ads and at what efficiency (MER) to run the business — while also making sure you:
- Cover your fixed costs.
- Hit your profit goals.
That’s exactly what StoreHero simplifies.
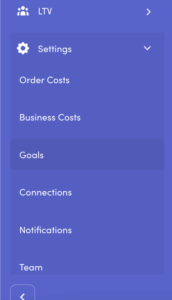
Setup
- Head to Settings > Goals.
The Four Key Pieces
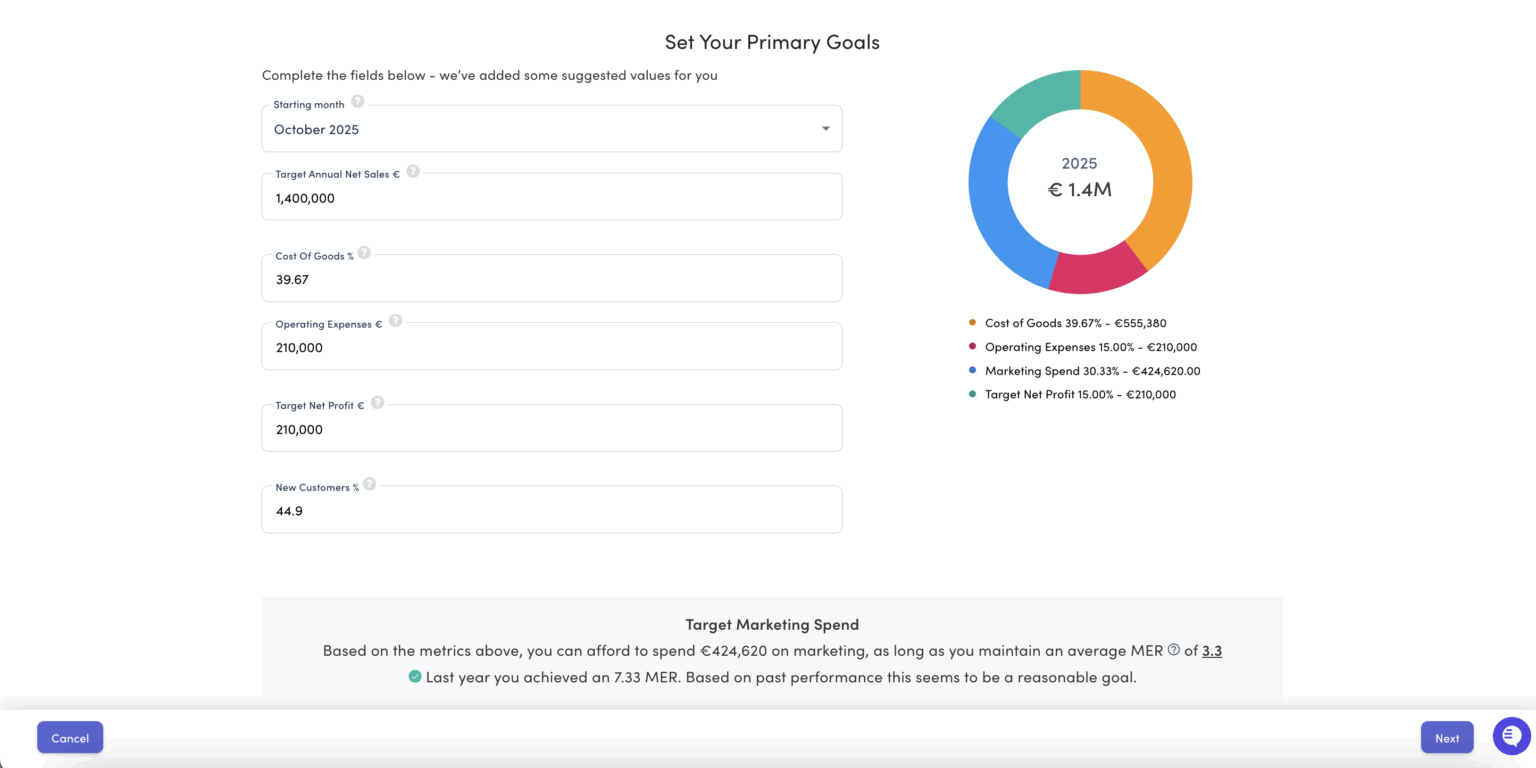
On the right-hand side, you’ll see a pie chart breaking everything down. Let’s walk through the slices:- Net Sales When we say Net Sales, we mean revenue after tax (VAT, GST, sales tax) has been stripped out, so no matter where you are, you’re working with a clean comparable number.
- COGS (Cost of Goods Sold) COGS here includes all landed costs, product, packaging, shipping, transaction fees, returns, and 3PL. These may vary depending on your market and logistics setup, but the principle stays the same.
- Operating Costs Essential operating costs: payroll, rent, insurance, software, and all day-to-day running costs. These need to be covered before you can scale profitably.
- Net Profit Goal The most important slice. Instead of forecasting “whatever profit is left over,” we help you set a profit objective first and work backwards.
Example Walkthrough
Let’s take a real example.- Net Sales: $14,000,000 (We’re using USD in this example, but StoreHero works in any currency, just swap the symbol for your local one.)
- COGS: 48% = $6,700,000
- Opex: $2,100,000
- Profit Goal: $2,100,000
Calculating Your Target Efficiency (MER)
When it comes to forecasting, we use MER (Marketing Efficiency Ratio) as the guiding metric, not ROAS. MER (sometimes called Blended ROAS in certain markets) is simply net sales ÷ marketing spend. How do you calculate MER vs ROAS – (If you’re wondering why, we’ve got more on that [here].) So in this case, your allowable marketing budget is $3.1M, which translates to a target MER of 4.55. So the math looks like this: $14,000,000 ÷ $3,100,000 = 4.55 MER Right now, most DTC brands in 2025 are seeing MER targets between 3-6, depending on product margins.Goal Feasibility Check
You’ll notice at the bottom of the screen an indicator showing whether your goal looks reasonable. To make this assessment, StoreHero looks back at last year’s performance — sales, spend, and profit — and compares it against your projected sales or profit increase. We also factor in your historical marketing efficiency to see if the target aligns with how your business has performed in the past. This gives you a quick sense of whether your goal is achievable or if it’s likely unrealistic. And if it does look unrealistic, no stress, that simply means you’ll need to adjust one of your core assumptions: either your gross margin/COGS or your profit and sales objectives. (More on how to do that here.)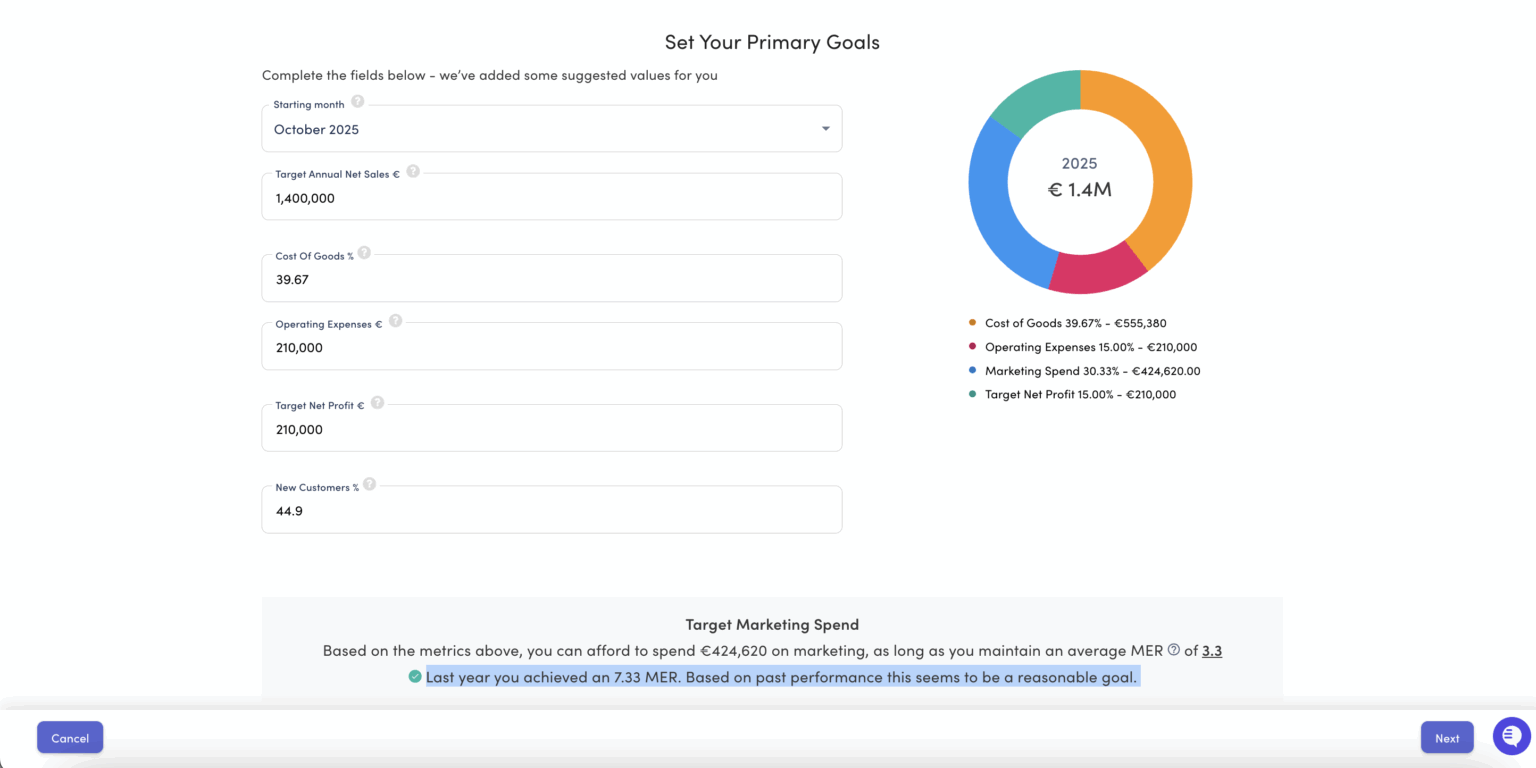
Generating Your Forecast
OK, great, once you’re happy with the goals you’ve set, go ahead and click Next in the bottom-right corner of the screen.
By doing this, you’re confirming: “These are the goals I want to hit.” From here, StoreHero gets to work behind the scenes, crunching last year’s data, layering in your profitability targets, and mapping out seasonality to build a complete 12-month forecast.
The result? A clear, actionable plan that shows you exactly what it will take to hit those goals. Once you hit Next, you’ll land on the forecast screen.
Viewing Your 12-Month Forecast
Now you can see your full 12-month forecast mapped out.
StoreHero has taken your sales, COGS, operating costs, and profit objectives, then layered in profitability insights to build a complete forecast. This doesn’t just cover topline sales; it also includes monthly marketing spend, AOV, CAC, new customer targets, repeat customer expectations, and order volumes.
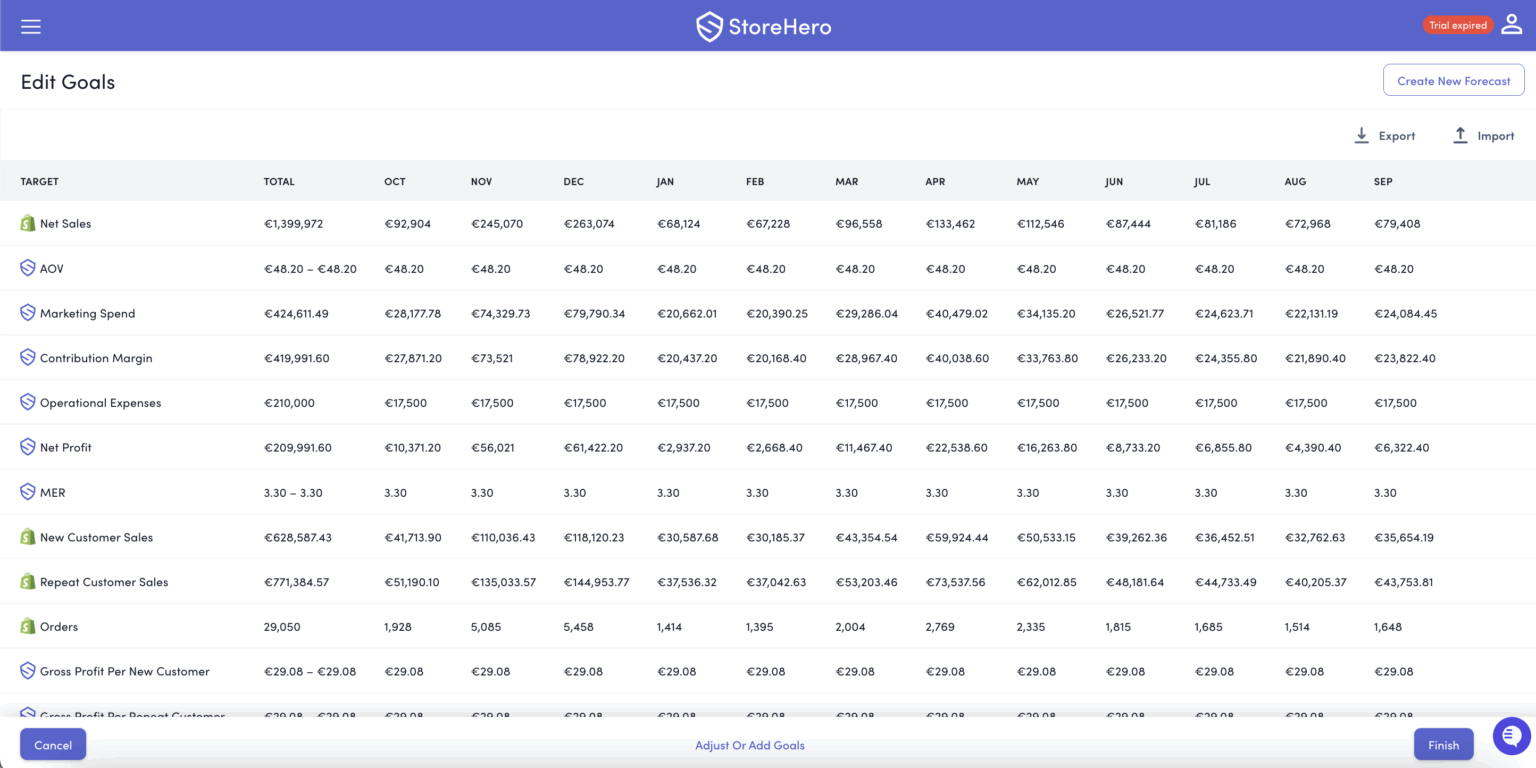
Finalizing Your Forecast
Once you’re happy with the 12-month forecast, click Finish in the bottom-right corner of the screen.
By doing this, you’re confirming that you’re ready to lock in the forecast and apply it to your account. From that point on, every time you log in, StoreHero will track your daily performance against the goals you’ve set, giving you a clear view of progress in real time.
Viewing StoreHero vs. Your Forecast
Great — your forecast is now built! The next step is learning how to use it to stay on track and make smarter business decisions.
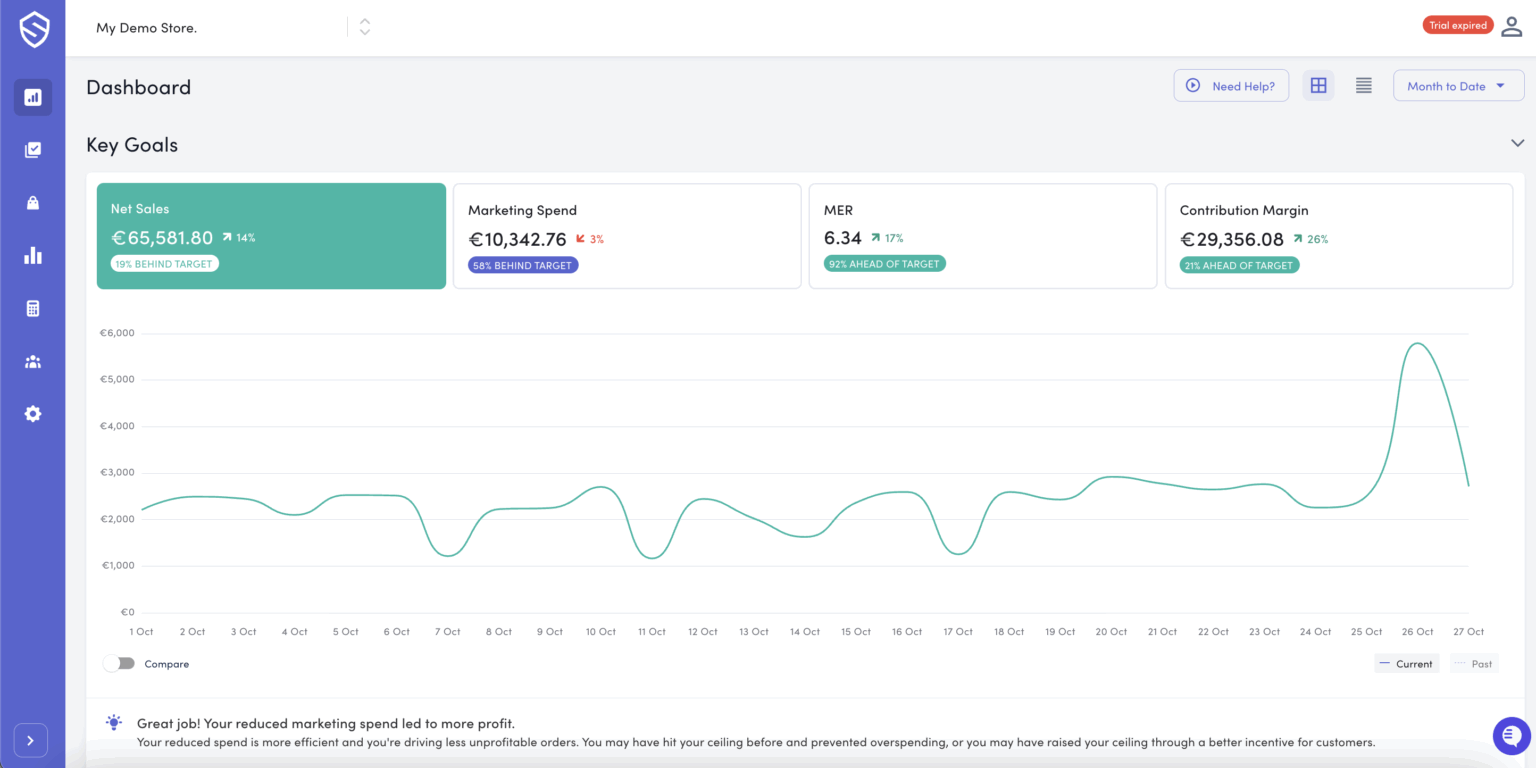
On the main dashboard, you’ll see the four key numbers every DTC brand should watch: Net Sales, Marketing Spend, MER, and Contribution Margin.
Each card shows two things:
- The % increase or decrease compared to the previous period.
- How far ahead or behind you are against your forecasted target for that metric.
This way, you’re not just seeing what happened, but whether you’re moving in line with your plan.
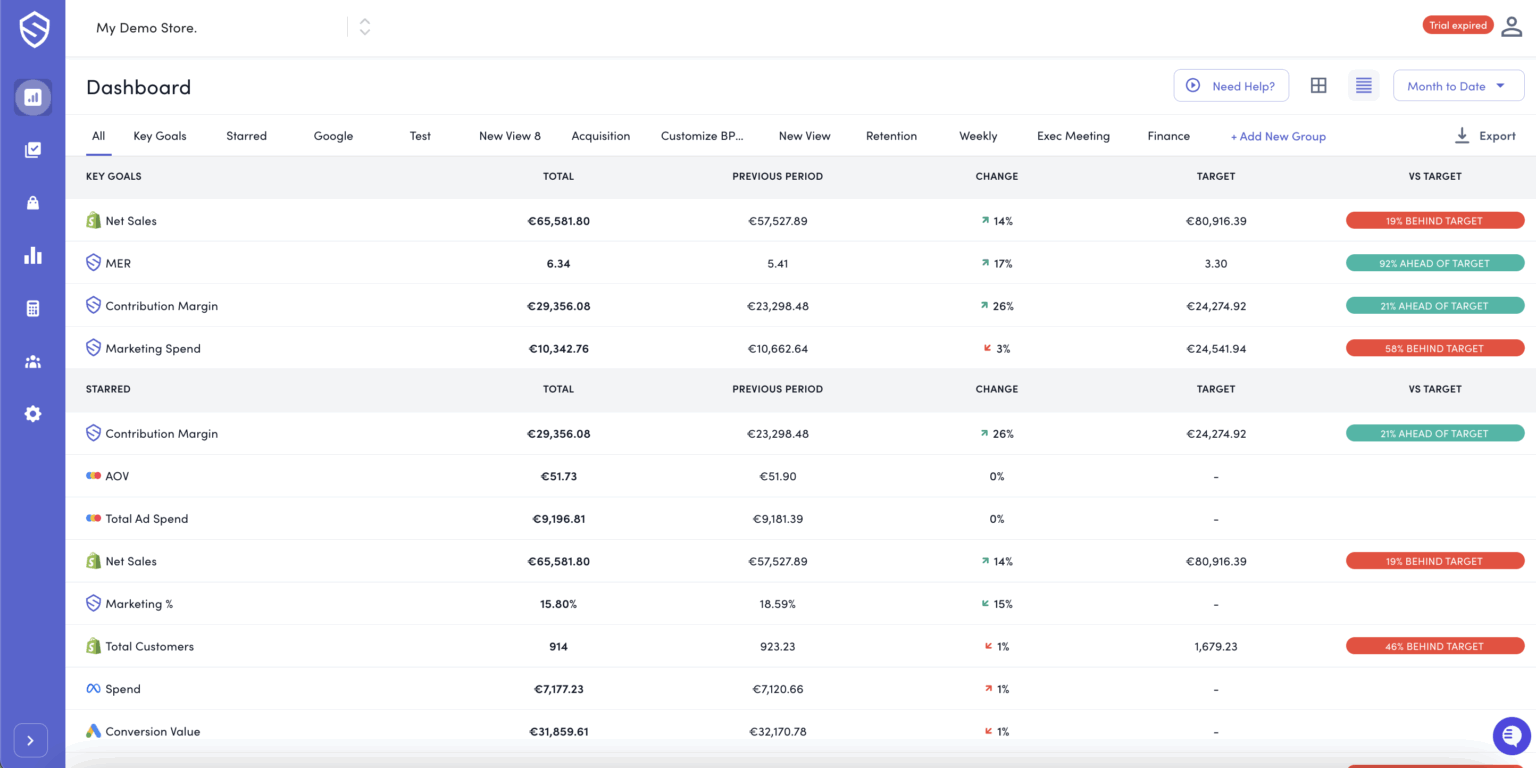
Digging Deeper: Actuals vs. Forecasted Goals
If you click the hamburger menu icon next to the date selector, you’ll land on a detailed performance view. Here, StoreHero shows not only how each metric is trending versus previous periods, but also how it stacks up against the profit forecast goals you’ve already set.
This is where things get powerful. Instead of finishing the week or month and saying “it was good” or “it was bad,” you can pinpoint why. For example:
- It was a good month because you hit your MER target, CAC came in below forecast, and new customer acquisition exceeded expectations.
- At the same time, COGS % ran higher than planned and repeat customers missed the target (even if only slightly).
By holding each number accountable, StoreHero helps you identify the exact areas that need attention. With accurate problem identification, you can be far more prescriptive in shaping your strategy and fixing issues, rather than guessing after the fact.
Closing Thoughts
Forecasting doesn’t have to be complex, slow, or guesswork. By flipping the model — starting with profit goals and working backwards into sales, COGS, and marketing efficiency — StoreHero gives you a clear plan that’s built around the realities of your business.
From daily dashboards to long-term targets, you now have a forecast that keeps you accountable, shows you where you’re winning, and highlights where strategy needs to shift. That means fewer surprises, fewer “bad months,” and more confidence that you’re building a profitable, sustainable brand.
🎥 Watch our 5-minute walkthrough: See how to build a profit-first forecast step-by-step inside StoreHero.
- How to set a profit goal and work backwards.
- How to calculate MER and test feasibility
- How StoreHero shows if your forecast is realistic
Here are some of the most common questions founders and ecommerce managers ask us about forecasting 👇
Look at last year’s MER (Net Sales ÷ Total Marketing Spend).
Compare to industry benchmarks (most DTC brands aim for MER 4–6 depending on margin).
Layer on your growth ambition: if you want faster growth, you may accept a lower MER short-term.
Test your feasibility, if you’re projecting MER 6 but historically you’ve achieved MER 3.5, you’re probably being too optimistic.
Work backwards: add up your COGS and operating expenses, then add your profit goal. That total is your revenue target. Subtract COGS + OPEX from that target, the remainder is your maximum ad spend if you still want to hit your profit goal.
Update it monthly with your actuals, quarterly with a bigger review, and immediately after big changes like launches or cost increases. A forecast only works if it reflects reality, treat it like a living document.
Divide your revenue goal by your planned ad spend to get your required MER, then compare it to your historical MER. If the gap is small, you can push efficiency; if it’s huge, adjust spend, revenue goals, or profit targets. StoreHero makes this easier by showing whether your forecast is realistic based on your actual performance.
OPEX are fixed costs that must be covered before you can generate profit. The higher your OPEX, the more revenue your forecast needs to support, which either raises your required MER or forces a bigger ad budget. StoreHero builds OPEX into your model so you can instantly see how cost changes shift your targets.
Gross margin is often the biggest lever you have. High margins let you spend more on ads while staying profitable; low margins leave little room, even with a strong MER. StoreHero shows this impact instantly — see more in our 3 Levers of Margin Expansion blog.
There isn’t a single “good” MER — it depends on your gross margin, sales targets, operating expenses, and profit goals. A MER that works for one brand might be unprofitable for another. StoreHero helps you find the right MER for your numbers by showing what’s realistic in your forecast.